
AdvisorCensus Metros Report
2026 edition, Form ADV data as of September 2026
The New York, NY metro area has the most investment advisory firms: 3,941 of the 43,466 in AdvisorCensus's September 2026 data. San Francisco, CA (1,778) and Los Angeles, CA (1,669) follow.
- Among metro areas with at least 100,000 households, the Bridgeport-Stamford-Danbury, CT metro area has by far the most SEC-registered advisers relative to its size: 109.9 per 100,000 households, against 13.4 across all 387 metro areas. San Francisco, CA (39.4) and New York, NY (36.1) are next.
- 29,234 of the 43,466 firms (67.3%) have a published principal office in one of the 387 metro areas. Of the other 14,232, 9,668 publish no office address, 3,412 are based outside the United States, and 1,152 are in U.S. territories, smaller U.S. towns, or at an address that can't be placed.
- Metro counts understate state-registered firms. The SEC withholds the address of a main office that is a private residence, and 6,629 of the 16,233 state-registered firms (40.8%) have no published office address, against 1,015 of the 17,149 SEC-registered firms (5.9%). The per-household figures and medians here therefore use SEC-registered firms.
- A firm is counted where its principal office is; branch offices are not counted.
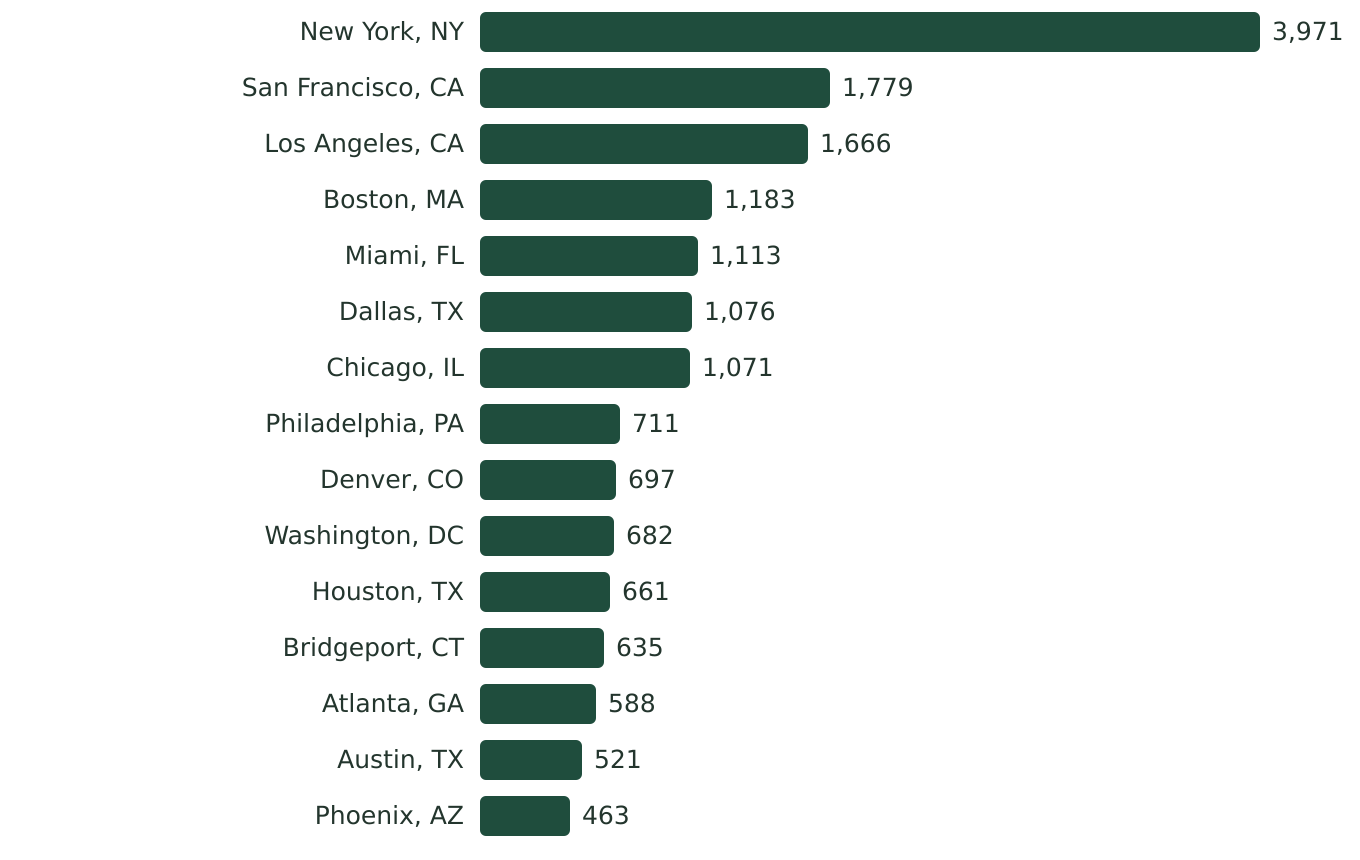
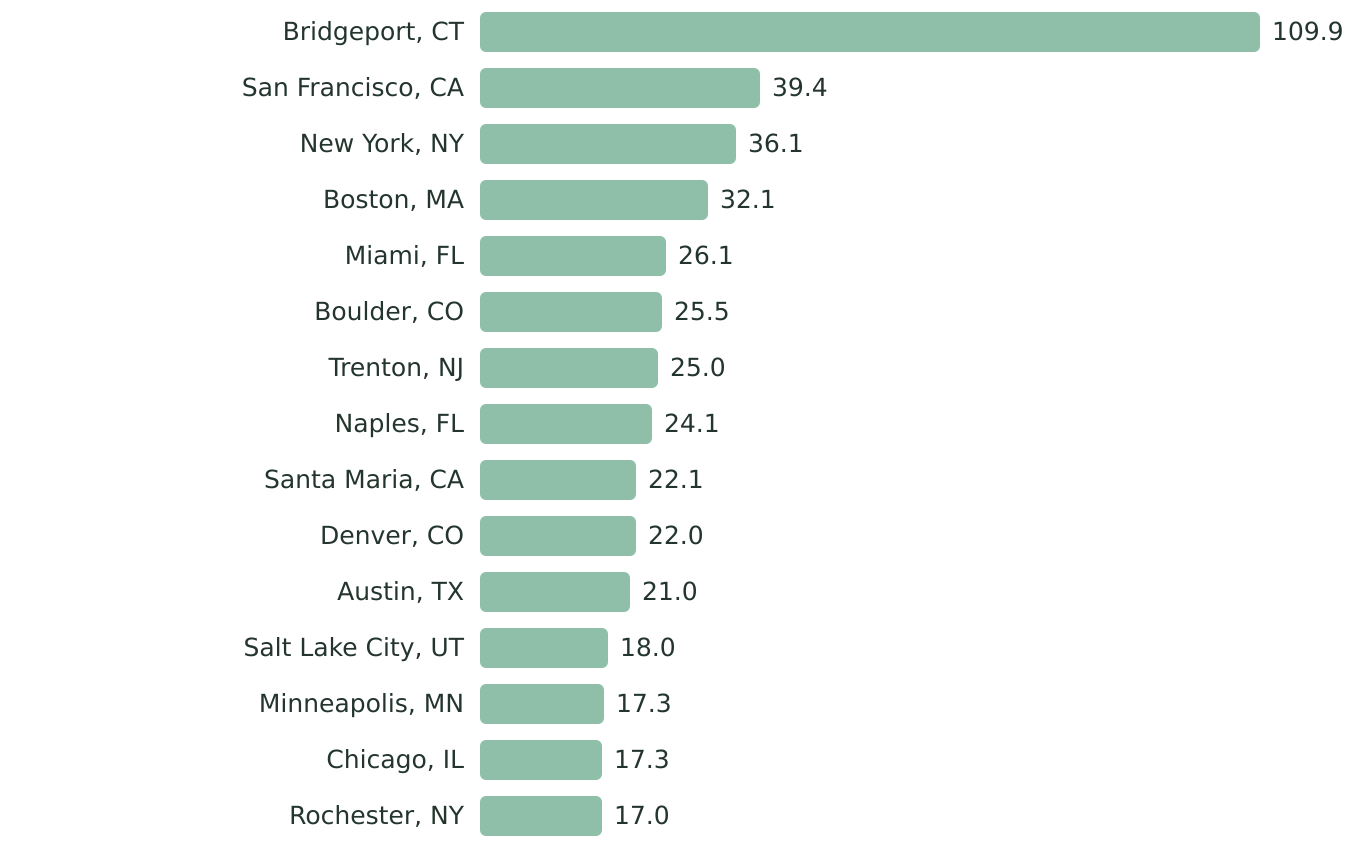
The 50 metro areas with the most firms
| Metro area | SEC-registered | State-registered | Exempt reporting advisers | All firms | SEC-registered per 100,000 households | Median assets under management, SEC-registered firms | New SEC registrations, Sept. 2025 to Aug. 2026 |
|---|---|---|---|---|---|---|---|
| New York, NY | 2,676 | 551 | 714 | 3,941 | 36.1 | $842 million | 201 |
| San Francisco, CA | 688 | 298 | 792 | 1,778 | 39.4 | $723 million | 54 |
| Los Angeles, CA | 714 | 588 | 367 | 1,669 | 15.9 | $513 million | 63 |
| Boston, MA | 622 | 293 | 271 | 1,186 | 32.1 | $892 million | 50 |
| Miami, FL | 610 | 263 | 233 | 1,106 | 26.1 | $403 million | 75 |
| Dallas, TX | 482 | 308 | 282 | 1,072 | 16.7 | $479 million | 39 |
| Chicago, IL | 630 | 299 | 136 | 1,065 | 17.3 | $637 million | 52 |
| Philadelphia, PA | 409 | 189 | 106 | 704 | 16.6 | $610 million | 26 |
| Denver, CO | 269 | 159 | 265 | 693 | 22.0 | $400 million | 25 |
| Washington, DC | 321 | 215 | 144 | 680 | 13.5 | $542 million | 24 |
| Houston, TX | 304 | 202 | 154 | 660 | 11.4 | $534 million | 32 |
| Bridgeport, CT | 390 | 80 | 164 | 634 | 109.9 | $921 million | 30 |
| Atlanta, GA | 295 | 251 | 43 | 589 | 12.8 | $435 million | 27 |
| Austin, TX | 208 | 129 | 178 | 515 | 21.0 | $419 million | 15 |
| Phoenix, AZ | 176 | 253 | 31 | 460 | 9.3 | $275 million | 23 |
| Seattle, WA | 200 | 148 | 100 | 448 | 12.4 | $379 million | 10 |
| San Jose, CA | 112 | 85 | 245 | 442 | 16.5 | $413 million | 10 |
| San Diego, CA | 181 | 165 | 79 | 425 | 15.5 | $397 million | 19 |
| Minneapolis, MN | 256 | 122 | 38 | 416 | 17.3 | $571 million | 12 |
| Detroit, MI | 168 | 141 | 24 | 333 | 9.5 | $373 million | 17 |
| Portland, OR | 139 | 110 | 14 | 263 | 13.8 | $389 million | 12 |
| St. Louis, MO | 147 | 76 | 33 | 256 | 12.7 | $535 million | 13 |
| Tampa, FL | 138 | 92 | 25 | 255 | 10.4 | $361 million | 15 |
| Kansas City, MO | 139 | 91 | 20 | 250 | 15.5 | $453 million | 11 |
| Baltimore, MD | 118 | 90 | 30 | 238 | 10.5 | $485 million | 11 |
| Charlotte, NC | 126 | 85 | 13 | 224 | 11.7 | $494 million | 13 |
| Nashville, TN | 105 | 57 | 41 | 203 | 12.7 | $426 million | 14 |
| Orlando, FL | 108 | 79 | 16 | 203 | 10.6 | $328 million | 14 |
| Cleveland, OH | 107 | 84 | 10 | 201 | 11.5 | $547 million | 10 |
| Indianapolis, IN | 97 | 86 | 12 | 195 | 11.5 | $338 million | 13 |
| Pittsburgh, PA | 101 | 76 | 17 | 194 | 9.5 | $528 million | 5 |
| Cincinnati, OH | 114 | 60 | 13 | 187 | 12.6 | $376 million | 6 |
| Columbus, OH | 89 | 84 | 10 | 183 | 10.3 | $382 million | 9 |
| Sacramento, CA | 60 | 91 | 24 | 175 | 6.8 | $206 million | 9 |
| Salt Lake City, UT | 81 | 52 | 33 | 166 | 18.0 | $473 million | 7 |
| Las Vegas, NV | 47 | 68 | 47 | 162 | 5.4 | $283 million | 5 |
| Milwaukee, WI | 93 | 46 | 21 | 160 | 14.2 | $470 million | 6 |
| San Antonio, TX | 54 | 59 | 28 | 141 | 5.6 | $383 million | 5 |
| Hartford, CT | 73 | 56 | 9 | 138 | 15.7 | $789 million | 3 |
| Raleigh, NC | 73 | 45 | 8 | 126 | 12.7 | $343 million | 10 |
| Richmond, VA | 70 | 47 | 9 | 126 | 13.1 | $522 million | 5 |
| Jacksonville, FL | 62 | 43 | 6 | 111 | 9.4 | $285 million | 9 |
| North Port, FL | 49 | 53 | 9 | 111 | 12.6 | $373 million | 4 |
| Providence, RI | 62 | 45 | 4 | 111 | 9.2 | $377 million | 10 |
| Oxnard, CA | 44 | 62 | 4 | 110 | 15.7 | $258 million | 2 |
| Rochester, NY | 76 | 29 | 5 | 110 | 17.0 | $168 million | 9 |
| Riverside, CA | 24 | 71 | 9 | 104 | 1.7 | $395 million | 2 |
| Boulder, CO | 35 | 32 | 36 | 103 | 25.5 | $286 million | 4 |
| Oklahoma City, OK | 37 | 49 | 17 | 103 | 6.5 | $252 million | 2 |
| Grand Rapids, MI | 58 | 32 | 10 | 100 | 13.2 | $452 million | 6 |
Firms with a published principal office in the metro area. State-registered counts are lower than the number of state-registered firms based there, because many publish no office address.
Download all 387 metro areas as CSV
New SEC registrations by quarter, and the 12-month rate for each large metro area, are in the Formation Barometer; compensation arrangements by metro area are in the Fees Report.
The data in this report is free to use under CC BY 4.0 with credit to AdvisorCensus and a link to this page; download the main table as CSV.
Share this report
Sources and method
Sources: Form ADV Part 1, from the SEC's monthly lists of registered and exempt reporting advisers and the state-registered adviser file on the SEC's Investment Adviser Public Disclosure website; metro areas as defined by the Office of Management and Budget; households from the Census Bureau's American Community Survey.
Which firms. The directory lists every firm that files Form ADV and has not withdrawn, as of September 2026, except any removed at the firm's request or for legal reasons: SEC-registered advisers, state-registered advisers, and exempt reporting advisers, which advise private funds and file only parts of Form ADV.
Where firms are counted. Each firm is counted in the metro area of its principal office, from the office's ZIP code and the HUD-USPS ZIP crosswalk; a ZIP code the crosswalk doesn't carry, such as a PO box, is placed by the filed city when every ZIP code of that city with the same first three digits is in one metro area. When the main office is a private residence, the SEC withholds its address and the firm's mailing address is used if it filed one; a firm with neither counts nationally but in no metro area. Metro areas are the 387 metropolitan statistical areas in the 50 states and the District of Columbia (OMB Bulletin 23-01, July 2023); Puerto Rico's six are not included.
Measures. Per-household figures and medians use SEC-registered firms, 94% of which publish an address. The median is across SEC-registered firms reporting positive regulatory assets under management (Form ADV Item 5.F). New SEC registrations are firms whose SEC registration took effect from September 1, 2025 through August 31, 2026 and that were not on the SEC's list on September 1, 2025, as in the Formation Barometer. Households are 2020–2024 American Community Survey 5-year estimates.
Cite this page
AdvisorCensus. AdvisorCensus Metros Report.
https://advisorcensus.com/reports/metros