
AdvisorCensus Formation Barometer
Quarterly edition, SEC lists through September 1, 2026
493 firms registered with the SEC as investment advisers in the second quarter of 2026, the most in any quarter since the fourth quarter of 2021, when AdvisorCensus's quarterly series begins. With 182 leaving the SEC's list, the number of SEC-registered advisers rose by 314 to 16,935.
- A year earlier, in the second quarter of 2025, 323 firms registered.
- Over the four quarters to June 2026, 1,550 firms registered, up 22% from 1,267 in the four quarters before.
- Exempt reporting advisers on the SEC's list rose by 113 to 6,535 in the same quarter, with 276 new and 161 leaving.
- From September 1, 2025 through August 31, 2026, Phoenix, AZ (14.6), Miami, FL (13.6), and Tampa, FL (12.3) had the most new registrations per 100 SEC-registered advisers among the 29 metro areas with at least 100, against 10.0 nationally.
- So far in the third quarter of 2026, 365 firms have registered (registrations through August 31).
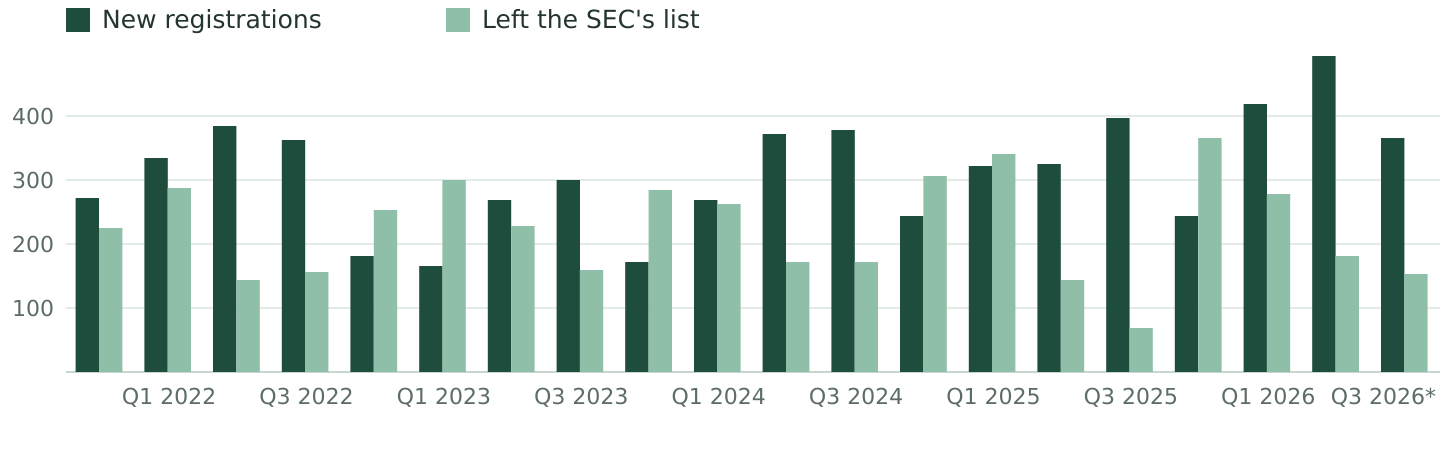
SEC-registered advisers by quarter
| Quarter | On the list at the start | New registrations | Left the list | Other changes | Net change | On the list at the end |
|---|---|---|---|---|---|---|
| Q3 2026 (through Aug. 31) | 16,935 | 365 | 152 | +1 | +214 | 17,149 |
| Q2 2026 | 16,621 | 493 | 182 | +3 | +314 | 16,935 |
| Q1 2026 | 16,475 | 417 | 279 | +8 | +146 | 16,621 |
| Q4 2025 | 16,358 | 244 | 365 | +238 | +117 | 16,475 |
| Q3 2025 | 16,245 | 396 | 69 | -214 | +113 | 16,358 |
| Q2 2025 | 16,044 | 323 | 142 | +20 | +201 | 16,245 |
| Q1 2025 | 15,941 | 321 | 340 | +122 | +103 | 16,044 |
| Q4 2024 | 15,987 | 244 | 306 | +16 | -46 | 15,941 |
| Q3 2024 | 15,754 | 379 | 172 | +26 | +233 | 15,987 |
| Q2 2024 | 15,531 | 370 | 171 | +24 | +223 | 15,754 |
| Q1 2024 | 15,495 | 268 | 262 | +30 | +36 | 15,531 |
| Q4 2023 | 15,565 | 171 | 283 | +42 | -70 | 15,495 |
| Q3 2023 | 15,392 | 301 | 158 | +30 | +173 | 15,565 |
| Q2 2023 | 15,300 | 269 | 228 | +51 | +92 | 15,392 |
| Q1 2023 | 15,399 | 165 | 300 | +36 | -99 | 15,300 |
| Q4 2022 | 15,419 | 182 | 253 | +51 | -20 | 15,399 |
| Q3 2022 | 15,167 | 363 | 156 | +45 | +252 | 15,419 |
| Q2 2022 | 14,889 | 385 | 143 | +36 | +278 | 15,167 |
| Q1 2022 | 14,811 | 333 | 287 | +32 | +78 | 14,889 |
| Q4 2021 | 14,723 | 273 | 226 | +41 | +88 | 14,811 |
Each row adds up: the start, plus new registrations, minus firms that left, plus other changes, is the end. Other changes are firms that joined the list with no registration date on file or with one outside the quarter (a firm that registers again carries its latest date), less new registrations that first appear on a list after the quarter ends. The large offsetting figures in the third and fourth quarters of 2025 come from the two lists the SEC did not publish (see the method).
Download both quarterly tables as CSV
Exempt reporting advisers on the SEC's list, by quarter
| Quarter | On the list at the start | New registrations | Left the list | Other changes | Net change | On the list at the end |
|---|---|---|---|---|---|---|
| Q3 2026 (through Aug. 31) | 6,535 | 192 | 41 | 0 | +151 | 6,686 |
| Q2 2026 | 6,422 | 276 | 161 | -2 | +113 | 6,535 |
| Q1 2026 | 6,214 | 397 | 190 | +1 | +208 | 6,422 |
| Q4 2025 | 5,937 | 253 | 72 | +96 | +277 | 6,214 |
| Q3 2025 | 5,819 | 254 | 53 | -83 | +118 | 5,937 |
| Q2 2025 | 5,769 | 175 | 133 | +8 | +50 | 5,819 |
| Q1 2025 | 5,557 | 316 | 189 | +85 | +212 | 5,769 |
| Q4 2024 | 5,614 | 179 | 254 | +18 | -57 | 5,557 |
| Q3 2024 | 5,486 | 170 | 92 | +50 | +128 | 5,614 |
| Q2 2024 | 5,696 | 145 | 416 | +61 | -210 | 5,486 |
| Q1 2024 | 6,038 | 249 | 683 | +92 | -342 | 5,696 |
| Q4 2023 | 5,980 | 115 | 144 | +87 | +58 | 6,038 |
| Q3 2023 | 5,846 | 116 | 68 | +86 | +134 | 5,980 |
| Q2 2023 | 5,749 | 138 | 133 | +92 | +97 | 5,846 |
| Q1 2023 | 5,598 | 220 | 212 | +143 | +151 | 5,749 |
| Q4 2022 | 5,530 | 130 | 155 | +93 | +68 | 5,598 |
| Q3 2022 | 5,357 | 143 | 43 | +73 | +173 | 5,530 |
| Q2 2022 | 5,243 | 189 | 163 | +88 | +114 | 5,357 |
| Q1 2022 | 5,078 | 260 | 204 | +109 | +165 | 5,243 |
| Q4 2021 | 4,992 | 116 | 104 | +74 | +86 | 5,078 |
Columns as above. Exempt reporting advisers join the list with no registration date on file, or with one outside the quarter, more often than registered advisers, so their other changes are larger.
New SEC registrations per 100 registered advisers by metro area, September 2025 through August 2026
The 29 metro areas with at least 100 SEC-registered advisers on September 1, 2025, highest rate first. The year-earlier rate uses the same definition for September 2024 through August 2025.
| Metro area | SEC-registered, Sept. 1, 2025 | New registrations, Sept. 2025 to Aug. 2026 | Per 100 registered | Per 100 registered, a year earlier |
|---|---|---|---|---|
| Phoenix, AZ | 157 | 23 | 14.6 | 9.1 |
| Miami, FL | 551 | 75 | 13.6 | 8.0 |
| Tampa, FL | 122 | 15 | 12.3 | 10.6 |
| Charlotte, NC | 114 | 13 | 11.4 | 6.5 |
| Detroit, MI | 152 | 17 | 11.2 | 7.7 |
| Houston, TX | 288 | 32 | 11.1 | 6.5 |
| San Diego, CA | 178 | 19 | 10.7 | 6.2 |
| Denver, CO | 255 | 25 | 9.8 | 7.8 |
| Baltimore, MD | 113 | 11 | 9.7 | 7.3 |
| Cleveland, OH | 103 | 10 | 9.7 | 4.6 |
| St. Louis, MO | 137 | 13 | 9.5 | 7.7 |
| Atlanta, GA | 285 | 27 | 9.5 | 7.4 |
| Los Angeles, CA | 707 | 63 | 8.9 | 9.2 |
| San Jose, CA | 114 | 10 | 8.8 | 10.6 |
| Portland, OR | 141 | 12 | 8.5 | 6.6 |
| Chicago, IL | 613 | 52 | 8.5 | 6.5 |
| Dallas, TX | 470 | 39 | 8.3 | 8.6 |
| Kansas City, MO | 134 | 11 | 8.2 | 8.7 |
| Boston, MA | 615 | 50 | 8.1 | 5.4 |
| San Francisco, CA | 675 | 54 | 8.0 | 7.4 |
| Bridgeport, CT | 381 | 30 | 7.9 | 7.0 |
| New York, NY | 2,598 | 201 | 7.7 | 6.4 |
| Austin, TX | 197 | 15 | 7.6 | 9.6 |
| Washington, DC | 322 | 24 | 7.5 | 7.9 |
| Philadelphia, PA | 399 | 26 | 6.5 | 7.4 |
| Cincinnati, OH | 115 | 6 | 5.2 | 7.1 |
| Seattle, WA | 199 | 10 | 5.0 | 9.0 |
| Pittsburgh, PA | 104 | 5 | 4.8 | 6.8 |
| Minneapolis, MN | 250 | 12 | 4.8 | 5.2 |
| United States | 16,358 | 1,635 | 10.0 | 8.0 |
Download all 337 metro areas as CSV
The data in this report is free to use under CC BY 4.0 with credit to AdvisorCensus and a link to this page; download the main table as CSV.
Share this report
Sources and method
Source: the SEC's monthly lists of registered investment advisers and exempt reporting advisers (Investment Adviser Information Reports).
Source. The SEC's monthly lists of registered investment advisers and exempt reporting advisers (its Investment Adviser Information Reports), captured by AdvisorCensus each month since September 2021. A quarter is measured from the list dated its first day to the list dated the first day of the next quarter.
New registrations. Firms whose SEC registration took effect during the quarter, that were not on the list dated the quarter's first day, and that appear on a later list within three months after the quarter. The same rule, over 12 months, gives the metro rates.
Departures. Firms on the quarter's first list that are not on the next quarter's first list: withdrawals, moves to state registration, and moves between SEC registration and exempt reporting.
Gaps. The SEC generated no October 1 or November 1, 2025 lists (the federal government shutdown), so the third quarter of 2025 ends with the September 1 list and departures during September 2025 appear in the fourth quarter. New registrations are placed by their registration date, so only a firm that registered and left again before the December 1, 2025 list would be missed.
Coverage. State-registered advisers are not included, because AdvisorCensus began capturing state data in September 2026. Metro areas are placed by principal office and shown when at least 100 SEC-registered advisers were on the list at the start of the 12 months.
Cite this page
AdvisorCensus. AdvisorCensus Formation Barometer.
https://advisorcensus.com/reports/formation-barometer