
AdvisorCensus Fees Report
2026 edition, Form ADV data as of September 2026
Of the 33,382 SEC- and state-registered investment advisers in AdvisorCensus's September 2026 data, 36.6% are fee-only: paid only by a percentage of assets, hourly charges, fixed fees, or subscription fees on Form ADV Item 5.E (no commissions, performance-based fees, or other compensation), with no sales-related compensation ties in the same filing: no employee registered with a broker-dealer or licensed as an insurance agent (Item 5.B), no brokerage, insurance, real estate, or other product sales business (Item 6.A), no related broker-dealer, insurance company, real estate broker, or futures commission merchant (Item 7.A), and no referral fees from others or other sales interest (Item 8).
- These are counts of firms. Counted by people, 4.9% of the 612,547 employees these firms report as performing investment advisory functions (Item 5.B(1)) work at a fee-only firm, and 84.2% work at a firm with sales-related compensation ties.
- Counting Item 5.E alone, 66.4% (22,151 firms) are paid only by fees. 9,923 of them are not fee-only because the same filing shows a sales-related compensation tie.
- 2.0% of registered firms (678) check commissions on Item 5.E, which asks only how a firm is paid for its advice. The ties through which a firm's people or affiliates earn commissions (broker-dealer registrations, insurance licenses, related companies) are reported in Items 5.B, 6.A, and 7.A instead: counting those, 45.2% of registered firms (15,094) show sales-related compensation ties.
- State-registered firms, which generally manage less than $100 million, are more often fee-only (48.1%) than SEC-registered firms (25.8%).
- The most common arrangement is a percentage of assets under management, reported by 90.2% of firms, followed by fixed fees (48.8%) and hourly charges (38.4%). A firm can report several.
- Performance-based fees are reported by 35.8% of SEC-registered firms and 8.0% of state-registered firms.
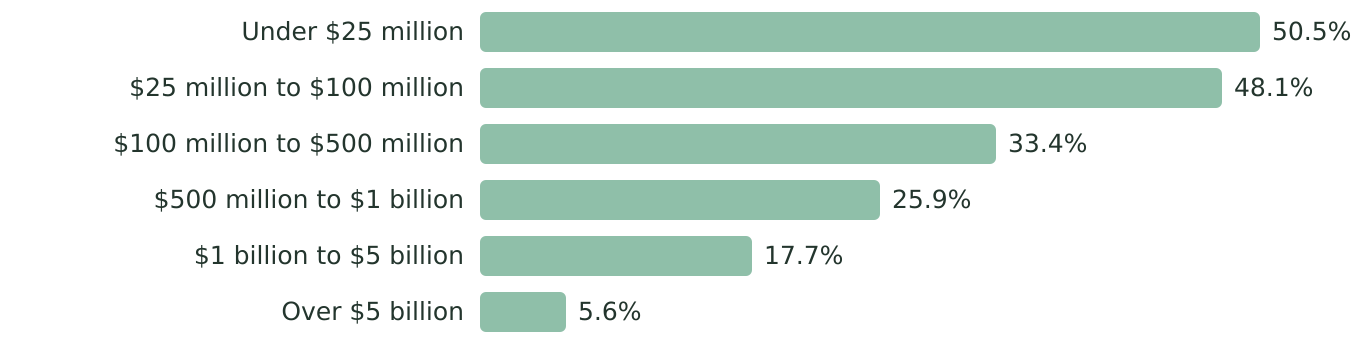
- The fee-only share is 50.5% for firms reporting under $25 million in assets under management and 48.1% for $25 million to $100 million, then falls with each larger band, to 5.6% for firms reporting over $5 billion.
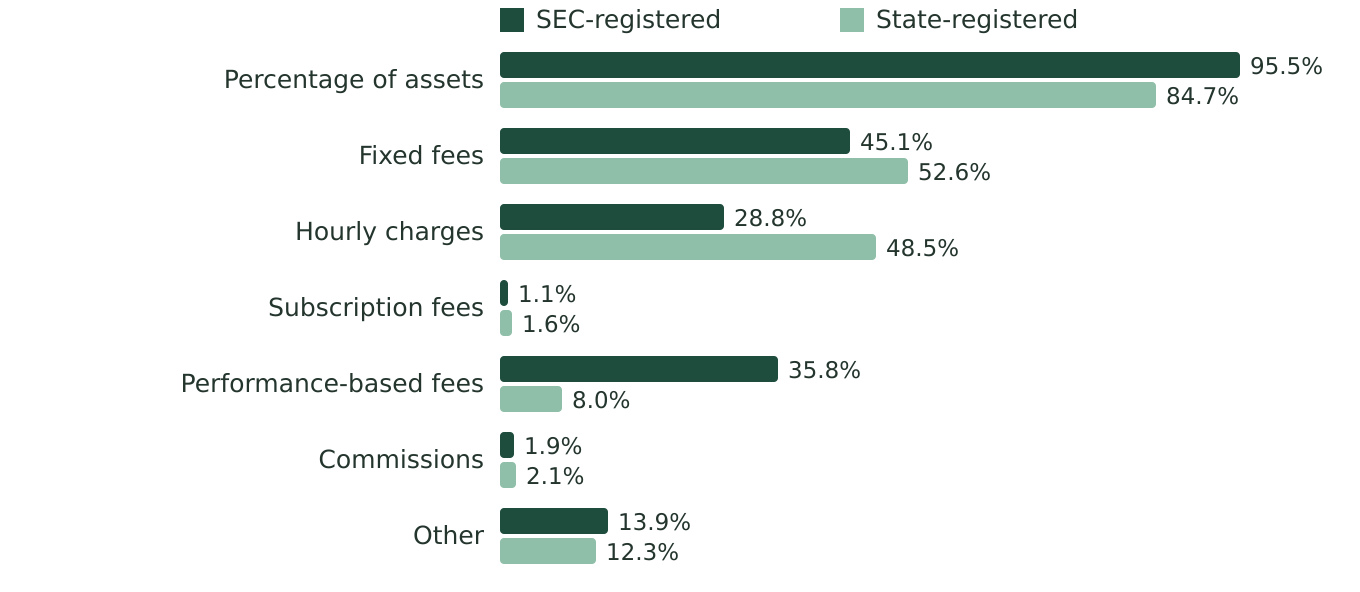
Compensation arrangements by registration type
| Arrangement (Item 5.E) | SEC-registered | State-registered | All registered firms |
|---|---|---|---|
| A percentage of assets under management | 95.5% | 84.7% | 90.2% |
| Fixed fees (other than subscription fees) | 45.1% | 52.6% | 48.8% |
| Hourly charges | 28.8% | 48.5% | 38.4% |
| Subscription fees (for a newsletter or periodical) | 1.1% | 1.6% | 1.3% |
| Performance-based fees | 35.8% | 8.0% | 22.3% |
| Commissions | 1.9% | 2.1% | 2.0% |
| Other | 13.9% | 12.3% | 13.2% |
| Paid only by fees (Item 5.E) | 54.9% | 78.5% | 66.4% |
| Fee-only (AdvisorCensus test) | 25.8% | 48.1% | 36.6% |
| Sales-related compensation ties | 47.6% | 42.7% | 45.2% |
| Firms | 17,149 | 16,233 | 33,382 |
Share of firms reporting each arrangement. A firm can report several, so the arrangements add up to more than 100%.
Counted by people
| Employees performing investment advisory functions (Item 5.B(1)) | SEC-registered | State-registered | All registered firms |
|---|---|---|---|
| All | 590,211 | 22,336 | 612,547 |
| At fee-only firms | 20,953 (3.6%) | 9,210 (41.2%) | 30,163 (4.9%) |
| At firms with sales-related compensation ties | 504,319 (85.4%) | 11,155 (49.9%) | 515,474 (84.2%) |
| At firms that check commissions on Item 5.E | 99,324 (16.8%) | 499 (2.2%) | 99,823 (16.3%) |
As each firm counts its own staff, including research staff; a person who works for two affiliated firms can be counted by each.
By assets under management
| Assets under management | Firms | Fee-only | Paid only by fees (Item 5.E) | Performance-based fees | Commissions |
|---|---|---|---|---|---|
| Under $25 million | 8,833 | 50.5% | 80.7% | 11.2% | 1.7% |
| $25 million to $100 million | 5,837 | 48.1% | 81.0% | 9.8% | 2.0% |
| $100 million to $500 million | 7,895 | 33.4% | 68.7% | 23.0% | 2.0% |
| $500 million to $1 billion | 2,440 | 25.9% | 55.3% | 36.5% | 2.5% |
| $1 billion to $5 billion | 3,290 | 17.7% | 41.1% | 50.6% | 1.5% |
| Over $5 billion | 2,103 | 5.6% | 24.2% | 64.2% | 2.1% |
| No assets under management reported | 2,984 | 33.3% | 55.8% | 5.3% | 3.3% |
The 25 metro areas with the most registered firms
| Metro area | Registered firms | Fee-only | Percentage of assets | Hourly charges |
|---|---|---|---|---|
| New York, NY | 3,227 | 15.9% | 90.4% | 16.5% |
| Los Angeles, CA | 1,302 | 29.6% | 90.8% | 36.1% |
| San Francisco, CA | 986 | 32.5% | 91.8% | 28.5% |
| Chicago, IL | 929 | 29.8% | 92.5% | 32.7% |
| Boston, MA | 915 | 33.0% | 90.1% | 32.7% |
| Miami, FL | 873 | 20.0% | 94.5% | 25.1% |
| Dallas, TX | 790 | 26.1% | 92.8% | 31.9% |
| Philadelphia, PA | 598 | 26.6% | 91.3% | 35.8% |
| Atlanta, GA | 546 | 36.8% | 91.8% | 44.1% |
| Washington, DC | 536 | 35.6% | 90.1% | 42.9% |
| Houston, TX | 506 | 31.2% | 91.1% | 32.6% |
| Bridgeport, CT | 470 | 15.7% | 92.3% | 10.4% |
| Phoenix, AZ | 429 | 28.4% | 91.8% | 49.7% |
| Denver, CO | 428 | 36.9% | 93.2% | 40.7% |
| Minneapolis, MN | 378 | 35.2% | 93.7% | 41.0% |
| Seattle, WA | 348 | 42.5% | 87.6% | 42.5% |
| San Diego, CA | 346 | 38.7% | 90.8% | 48.3% |
| Austin, TX | 337 | 32.3% | 91.7% | 33.8% |
| Detroit, MI | 309 | 31.4% | 87.7% | 43.7% |
| Portland, OR | 249 | 50.2% | 96.4% | 52.2% |
| Kansas City, MO | 230 | 32.2% | 91.3% | 44.8% |
| Tampa, FL | 230 | 23.5% | 93.9% | 44.3% |
| St. Louis, MO | 223 | 30.5% | 93.7% | 42.6% |
| Charlotte, NC | 211 | 32.7% | 96.7% | 44.1% |
| Baltimore, MD | 208 | 39.9% | 83.7% | 49.0% |
Firms with a published office address in the metro area. 6,629 of the 16,233 state-registered firms have none (the SEC withholds the address of an office that is a private residence), so the metro figures lean toward SEC-registered firms.
Download all 366 metro areas as CSV
These are the arrangements firms check on Form ADV, not fee levels. A firm's own page lists its arrangements and, where AdvisorCensus has read its brochure, the fees the brochure states.
The data in this report is free to use under CC BY 4.0 with credit to AdvisorCensus and a link to this page; download the main table as CSV.
Share this report
Sources and method
Source: Form ADV Part 1A, Items 5.E (compensation arrangements) and 5.F (regulatory assets under management), from the SEC's monthly lists of registered advisers and the state-registered adviser file on the SEC's Investment Adviser Public Disclosure website.
What firms report. Form ADV Part 1A, Item 5.E asks how a firm is compensated for its advisory services, and the firm checks every arrangement that applies: a percentage of assets under management, hourly charges, subscription fees (for a newsletter or periodical), fixed fees (other than subscription fees), commissions, performance-based fees, or other. Exempt reporting advisers do not complete Item 5, so they are not included.
Paid only by fees. Every arrangement the firm checked on Item 5.E is a percentage of assets under management, fixed fees, hourly charges, or subscription fees.
Sales-related compensation ties. The filing shows commissions on Item 5.E(5); an employee who is a registered representative of a broker-dealer or a licensed insurance agent (Item 5.B(2), 5.B(5)); a brokerage, broker-dealer representative, futures commission, real estate, insurance, or other financial product sales business (Item 6.A(1), (2), (4), (5), (6), (14)); a related broker-dealer, futures commission merchant, insurance company or agency, or real estate broker or dealer (Item 7.A(1), (7), (12), (14)); another sales interest in securities it recommends (Item 8.B(3)); or compensation from others for client referrals (Item 8.I).
Fee-only. Form ADV has no fee-only box. AdvisorCensus counts a firm as fee-only when it is paid only by fees on Item 5.E and the same filing shows no sales-related compensation ties. An Item 6.A or 7.A section the state filing data leaves out is one in which nothing is checked. The figures describe filed answers; they are not a fee-only designation.
Counted by people. Employees who perform investment advisory functions, including research, as each firm reports them on Item 5.B(1).
For comparison. The Investment Adviser Association's Investment Adviser Industry Snapshot 2026 (Table 4A) reports these Item 5.E shares for SEC-registered advisers in 2025: assets under management 95.5%, fixed fees 45.2%, performance-based fees 35.9%, hourly charges 28.8%, other 14.1%, commissions 1.9%, and subscription fees 1.1%.
Firms and groups. SEC- and state-registered advisers in the directory as of September 2026. Assets bands use regulatory assets under management (Item 5.F); firms that report none are shown separately. Metro areas use the principal office, and a firm without a published address counts nationally but in no metro area.
Cite this page
AdvisorCensus. AdvisorCensus Fees Report.
https://advisorcensus.com/reports/fees