
AdvisorCensus Monthly Adviser Report, October 2026
October 2026 edition, SEC lists through October 1, 2026
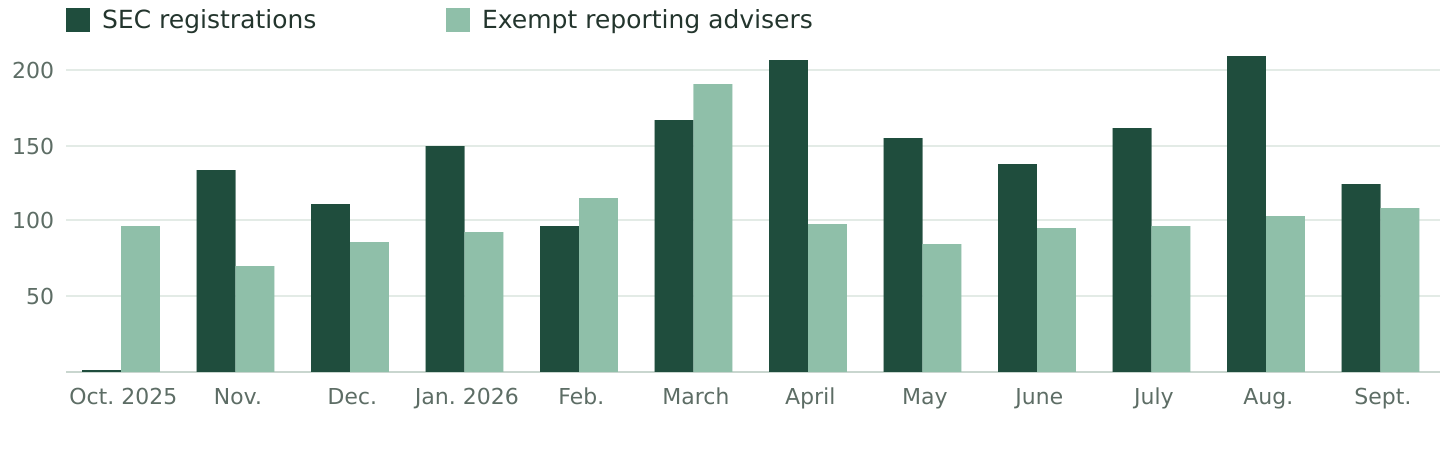
134 newly registered investment advisers first appear on the SEC's October 1 list (125 registered in September): 0.8 for every 100 already registered, down 35% from 207 on the September 1 list. Over the past 12 months, 1,653 firms registered, 10.1 for every 100 registered at the start, up from 7.3 in the 12 months before.
- New SEC registrations from October 2025 through September 2026: 1,653, 10.1 for every 100 firms registered at the start (16,358), against 1,164 and 7.3 per 100 (of 15,987) in the 12 months before. New registrations rose 42%.
- After withdrawals and moves to state registration or exempt reporting, the number of SEC-registered advisers rose by 852 (+5.2%) to 17,210, against a rise of 371 (+2.3%) a year earlier.
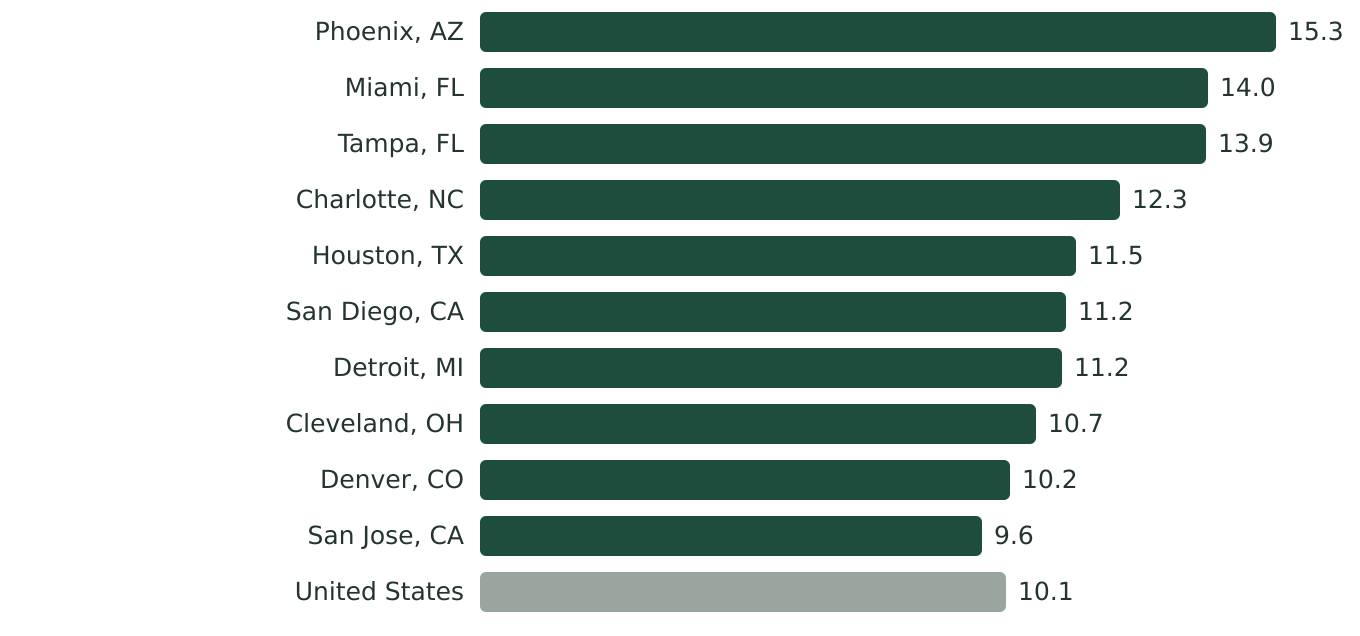
- Among the 29 metro areas with at least 100 SEC-registered advisers, Phoenix, AZ (15.3), Miami, FL (14.0), and Tampa, FL (13.9) had the most new registrations per 100 over the 12 months, against 10.1 nationally; Pittsburgh, PA (4.8), Minneapolis, MN (5.2), and Cincinnati, OH (5.2) had the fewest.
- New York, NY had the most new registrations, 206, or 7.9 per 100 of its 2,598 SEC-registered advisers.
- On the October 1, 2026 list, New York, NY (21), San Francisco, CA (8), and Los Angeles, CA (7) had the most newly registered advisers.
- Exempt reporting advisers (advisers to private funds that report to the SEC without registering): 1,236 began reporting over the 12 months, 20.8 per 100 of the 5,937 on the SEC's list at the start, against 15.5 per 100 (870 of 5,614) a year earlier.
- 354 firms reported a change in regulatory assets under management in the October data. Of the 302 that had reported a figure before, 263 reported an increase, and the median change was +20.2%; the other 52 reported a figure for the first time.
The month in numbers
Each month's list against the one before it.
| September 2026 list | October 2026 list | Change | |
|---|---|---|---|
| Newly registered advisers on the SEC's list | 207 | 134 | -73 |
| New exempt reporting advisers on the SEC's list | 97 | 113 | +16 |
| Advisers that left the SEC's registered list | 76 | 73 | -3 |
| Exempt reporting advisers that left the SEC's list | 15 | 21 | +6 |
| Successions reported (a firm taking over another's advisory business) | 7 | 2 | -5 |
| Moves between registration types | 13 | 40 | +27 |
| Legal or business name changes | 21 | 40 | +19 |
| Firms with changed Item 11 disclosure answers | 14 | 46 | +32 |
On the October list, 6 firms moved from SEC to state registration and 2 from SEC registration to exempt reporting; these are counted among the advisers that left the SEC's registered list. Newly registered advisers were not on the previous list and registered with the SEC in the month before the list (or late in the month before that, if they missed the previous list).
New registrations compared with existing registrations
SEC-registered investment advisers. The start of each period is the SEC's list dated its first day.
| Oct. 2024 to Sept. 2025 | Oct. 2025 to Sept. 2026 | |
|---|---|---|
| Registered at the start of the period | 15,987 | 16,358 |
| New registrations during the period | 1,164 | 1,653 |
| New registrations per 100 registered at the start | 7.3 | 10.1 |
| Registered at the end of the period | 16,358 | 17,210 |
| Net change in registered advisers | +371 | +852 |
| Net change, percent | +2.3% | +5.2% |
Exempt reporting advisers on the SEC's list
| Oct. 2024 to Sept. 2025 | Oct. 2025 to Sept. 2026 | |
|---|---|---|
| On the list at the start of the period | 5,614 | 5,937 |
| Began reporting during the period | 870 | 1,236 |
| Began reporting per 100 on the list at the start | 15.5 | 20.8 |
| On the list at the end of the period | 5,937 | 6,778 |
| Net change | +323 | +841 |
| Net change, percent | +5.8% | +14.2% |
New registrations per 100 registered advisers by metro area, Oct. 2025 to Sept. 2026
The 29 metro areas with at least 100 SEC-registered advisers on October 1, 2025, highest rate first.
| Metro area | SEC-registered, Oct. 1, 2025 | New registrations, Oct. 2025 to Sept. 2026 | Per 100 registered | Per 100 registered, Oct. 2024 to Sept. 2025 |
|---|---|---|---|---|
| Phoenix, AZ | 157 | 24 | 15.3 | 8.3 |
| Miami, FL | 551 | 77 | 14.0 | 7.4 |
| Tampa, FL | 122 | 17 | 13.9 | 10.7 |
| Charlotte, NC | 114 | 14 | 12.3 | 5.5 |
| Houston, TX | 288 | 33 | 11.5 | 5.8 |
| San Diego, CA | 178 | 20 | 11.2 | 6.7 |
| Detroit, MI | 152 | 17 | 11.2 | 6.9 |
| Cleveland, OH | 103 | 11 | 10.7 | 4.7 |
| Denver, CO | 255 | 26 | 10.2 | 6.2 |
| San Jose, CA | 114 | 11 | 9.6 | 7.5 |
| Los Angeles, CA | 707 | 68 | 9.6 | 8.6 |
| Atlanta, GA | 285 | 26 | 9.1 | 7.4 |
| Chicago, IL | 613 | 55 | 9.0 | 6.1 |
| Baltimore, MD | 113 | 10 | 8.8 | 7.3 |
| San Francisco, CA | 675 | 59 | 8.7 | 6.8 |
| Austin, TX | 197 | 17 | 8.6 | 8.5 |
| Portland, OR | 141 | 12 | 8.5 | 6.6 |
| Kansas City, MO | 134 | 11 | 8.2 | 6.2 |
| St. Louis, MO | 137 | 11 | 8.0 | 6.9 |
| Boston, MA | 615 | 49 | 8.0 | 4.9 |
| New York, NY | 2,598 | 206 | 7.9 | 5.5 |
| Bridgeport, CT | 381 | 30 | 7.9 | 5.9 |
| Dallas, TX | 470 | 36 | 7.7 | 8.1 |
| Philadelphia, PA | 399 | 28 | 7.0 | 7.4 |
| Washington, DC | 322 | 20 | 6.2 | 6.6 |
| Seattle, WA | 199 | 11 | 5.5 | 7.5 |
| Cincinnati, OH | 115 | 6 | 5.2 | 7.0 |
| Minneapolis, MN | 250 | 13 | 5.2 | 4.4 |
| Pittsburgh, PA | 104 | 5 | 4.8 | 5.8 |
| United States | 16,358 | 1,653 | 10.1 | 7.3 |
Download all 337 metro areas as CSV
New registrations compared with a year earlier, by metro area
Metro areas with at least 100 SEC-registered advisers at the start and at least 10 new registrations in the earlier 12 months (20 metro areas), largest increase first.
| Metro area | New registrations, Oct. 2024 to Sept. 2025 | New registrations, Oct. 2025 to Sept. 2026 | Percent change |
|---|---|---|---|
| Houston, TX | 16 | 33 | +106% |
| Phoenix, AZ | 12 | 24 | +100% |
| Miami, FL | 39 | 77 | +97% |
| Detroit, MI | 10 | 17 | +70% |
| San Diego, CA | 12 | 20 | +67% |
| Boston, MA | 30 | 49 | +63% |
| Denver, CO | 16 | 26 | +63% |
| Chicago, IL | 37 | 55 | +49% |
| New York, NY | 142 | 206 | +45% |
| Tampa, FL | 12 | 17 | +42% |
| Bridgeport, CT | 22 | 30 | +36% |
| Atlanta, GA | 20 | 26 | +30% |
| San Francisco, CA | 46 | 59 | +28% |
| Minneapolis, MN | 11 | 13 | +18% |
| Los Angeles, CA | 59 | 68 | +15% |
| Austin, TX | 16 | 17 | +6% |
| Dallas, TX | 37 | 36 | -3% |
| Philadelphia, PA | 29 | 28 | -3% |
| Washington, DC | 21 | 20 | -5% |
| Seattle, WA | 15 | 11 | -27% |
| United States | 1,164 | 1,653 | +42% |
The other 9 had fewer than 10 new registrations a year earlier, too few for a percentage to mean much: Charlotte, NC (6, then 14), Cleveland, OH (5, then 11), San Jose, CA (8, then 11), Baltimore, MD (8, then 10), Portland, OR (9, then 12), Kansas City, MO (8, then 11), St. Louis, MO (9, then 11), Cincinnati, OH (8, then 6), and Pittsburgh, PA (6, then 5).
Newly registered advisers by metro area, October 1, 2026 list
| Metro area | Newly registered |
|---|---|
| New York, NY | 21 |
| San Francisco, CA | 8 |
| Los Angeles, CA | 7 |
| Chicago, IL | 6 |
| Miami, FL | 6 |
| Bridgeport, CT | 3 |
| Minneapolis, MN | 3 |
| Phoenix, AZ | 3 |
These 8 metro areas account for 57 of the 134. Another 46 are in other metro areas, none with more than 2, and 31 are outside the 387 metropolitan areas (U.S. territories, smaller towns, other countries, or no published address).
Download every metro area's count as CSV
The data in this report is free to use under CC BY 4.0 with credit to AdvisorCensus and a link to this page; download the main table as CSV.
Share this report
Sources and method
Sources: the SEC's monthly lists of registered investment advisers and exempt reporting advisers (Investment Adviser Information Reports), and AdvisorCensus's month-to-month comparison of Form ADV filings.
Source. The SEC's monthly Investment Adviser Information Reports, which list every SEC-registered adviser and every exempt reporting adviser, captured by AdvisorCensus each month since September 2021. A month's list is the file dated the first of that month.
New registrations over 12 months. A firm on the SEC's list of registered advisers at any point during the 12 months that was not on it at the start, and whose SEC registration took effect during the 12 months. A firm that moved from exempt reporting or state registration to SEC registration counts; one that reappears with an earlier registration date does not. Exempt reporting advisers are counted the same way from the SEC's list of exempt reporting advisers. Rates are per 100 on the list at the start; net change compares the lists at the start and end, so it reflects withdrawals and moves as well.
This month. The October figures compare the October 1, 2026 list with the September 1, 2026 list, and the September figures compare that list with the one before. Successions, moves between registration types, name changes, and disclosure answer changes come from AdvisorCensus's month-to-month comparison of each firm's filing, one count for each change.
Metro areas. Placed by principal office, from the ZIP code (see the methodology). Rates are shown for metro areas with at least 100 SEC-registered advisers at the start of the 12 months, and year-over-year changes for those with at least 10 new registrations in the earlier 12 months, so small counts don't produce large percentages. Exempt reporting advisers are reported nationally only.
Gaps. The SEC posted no data for its October 1 and November 1, 2025 lists, which fell during the federal government shutdown (October 1 to November 12, 2025), so firms that registered from September through November 2025 first appear on the December 1 list; the 12-month counts include them. During the shutdown the SEC could not approve registrations (its operations plan for a lapse in appropriations), which is why none are dated October 2025.
Coverage. State-registered advisers are not in the new-registration counts, because AdvisorCensus began capturing state data in September 2026. Regulatory assets under management are from Item 5.F; most firms update them once a year, so a month's changes reflect the firms that filed an annual or other amendment that month. Regulators grant registration but don't verify the answers firms file on Form ADV. AdvisorCensus does not rate, rank, verify, or recommend firms.
Other editions
This report as Markdown: /reports/monthly/2026-10.md
Cite this page
AdvisorCensus. AdvisorCensus Monthly Adviser Report, October 2026.
https://advisorcensus.com/reports/monthly/2026-10